Outperform the market
with Seasonate!
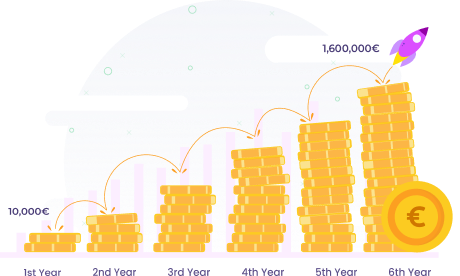
How have you been able to generate 1,6 Million Euro out of 10,000 Euro just within 6 years
Learn More
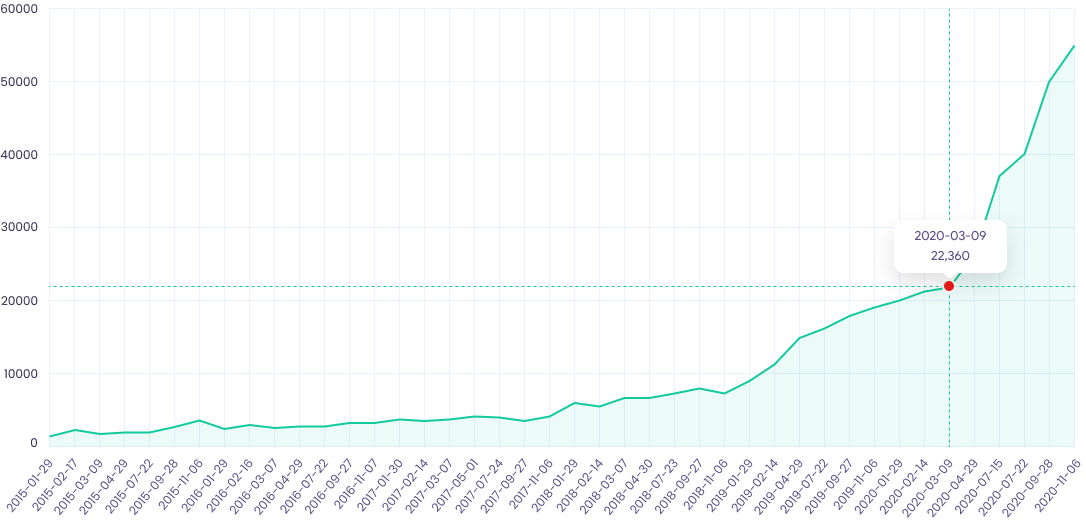
Seasonality are predictable situations that recurry every calendar year. We are
showing 7 trades which happen one after the other – and lead into recurring
profits over the last 10 years.
| Stock name | Start date | Start price | End date | End price | Profit | Profit % | Capital |
|---|---|---|---|---|---|---|---|
| Netflix | 2015-01-02 | 49.85 | 2015-01-29 | 63.4 | 13.55 | 27.18% | 12,718 |
| 1-800-Flowers.com | 2015-01-30 | 7.89 | 2015-02-17 | 10.75 | 2.86 | 36.25% | 17,328 |
| Sunesis Pharmaceuticals Inc | 2015-02-17 | 133.8 | 2015-03-09 | 131.4 | -2.40 | -1.79% | 17,018 |
| Volkswagen AG | 2015-03-23 | 225.98 | 2015-04-29 | 227.3 | 1.32 | 0.58% | 17,117 |
| Alphabet | 2015-06-08 | 526.83 | 2015-07-22 | 662.1 | 135.27 | 25.68% | 21,512 |
| NIKE Inc. | 2015-07-31 | 53.87 | 2015-09-28 | 57.4 | 3.53 | 6.55% | 22,921 |
| Microsoft Inc. | 2015-10-02 | 41.31 | 2015-11-06 | 49.78 | 8.47 | 20.50% | 27,620 |
| Netflix | 2016-01-04 | 109.96 | 2016-01-29 | 91.84 | -18.12 | -16.48% | 23,069 |
Seasonality are predictable situations that recurry every calendar year. We are
showing 7 trades which happen one after the other – and lead into recurring
profits over the last 10 years.

Netflix did rise between January 2nd and January 29th by average profit of 17.99% percent and had only 1 loss in 2016

1-800-Flowers.com did rise between January 30th and February 14th by average profit of 1 14.99% percent and had only 1 loss in 2018

Sunesis Pharmaceuticals Inc did rise between February 18th and March 9th by average profit of 14.99% percent and had only 1 loss in 2015

Volkswagen AG did rise between March 23rd and April 29th by average profit of 14.99% percent

Alphabet did rise between June 8th and July 22nd by average profit of 14.99% percent

NIKE Inc. did rise between July 31st and September 28th by average profit of 8.99%percent and had only 1 loss in 2017

Microsoft Inc. did rise between October 2nd and November 6th by average profit of 9.99% percent and had only 1 loss in 2018